Tobin's Q on S&P 500 companies
by Jakub Brettl
The concept
Tobin's Q is a financial indicator that measures the ratio of market value of an asset relative to it's replacement cost. Seen somewhat differently, the ratio expresses a relationship between the market value of an asset and its intrinsic value.
When the ratio is equal to one an equilibrium is reached. On the other hand, when the ratio is above/below one the asset may be seen as overvalued/undervalued.
Obtaining/calculating a price of an asset may be relatively easy. Indeed market prices are publicly available for many financial assets. However, the key difficulty may arise when determining the "replacement cost" of the asset.
In some cases market price for a directly substitutable asset can be used as a replacement cost. In practice this approach may pose challenges since often there aren't any direct substitutes for a given asset. In the context of financial assets the book value of an asset can be used as a proxy to the replacement cost.
The approach can be applied not just at a level of individual assets, but also on a level of an entire firm.
Thus, for the purpose of this blog post, I will use the following method:
Origins
The concept was first introduced by Nicholas Kaldor in 1966 paper "Marginal Productivity and the Macro-Economic Theories of Distribution: Comment on Samuelson and Modigliani".
James Tobin then popularised the idea in the 1970's.
Sadly, the original papers are not freely accessible online...
Estimation
First thing first: Any of the analysis that I will be showing below can be reproduced using the code in this notebook.
Data
To perform the analysis I collected data from Yahoo finance on S&P 500 companies (using Python's yfinance and pandas_datareader pandas_datareader libraries).
The yfinance library provides financial data from the latest financial statements reported by the firms, pandas_datareader provides total market capitalisation for a list of provided tickers firms.
In order to fetch financial data form the data sources above, one needs a list of S&P 500 components (tickers). I obtained this list from the first website that came on on google search.
Out of 505 firms listed in the S&P 500 index I was able to collect data on 495.
An important note on the data, I used the latest available financial data from yfinance which are from Q3 2021, while the market cap data are from end January 2021. While I could have obtained/estimate average market cap for Q3 2021, for the purposes of this post, I am merely interested in gaining an intuition on the subject as oppose to performing serious economic research.
Results
When performing the analysis, I experimented with different approaches (particularly in the context of deciding on measure of book value of equity). You can see the different options that I considered in this notebook..
As mentioned above the data for the numerator (market capitalisation) is collected from pandas_datareader. Data for the denominator (book value of equity) is collected using yfinance - I use the "Total Stockholder Equity" in companies' balance sheets.
As a reminder, I estimate Tobin's Q as follows:

Distribution
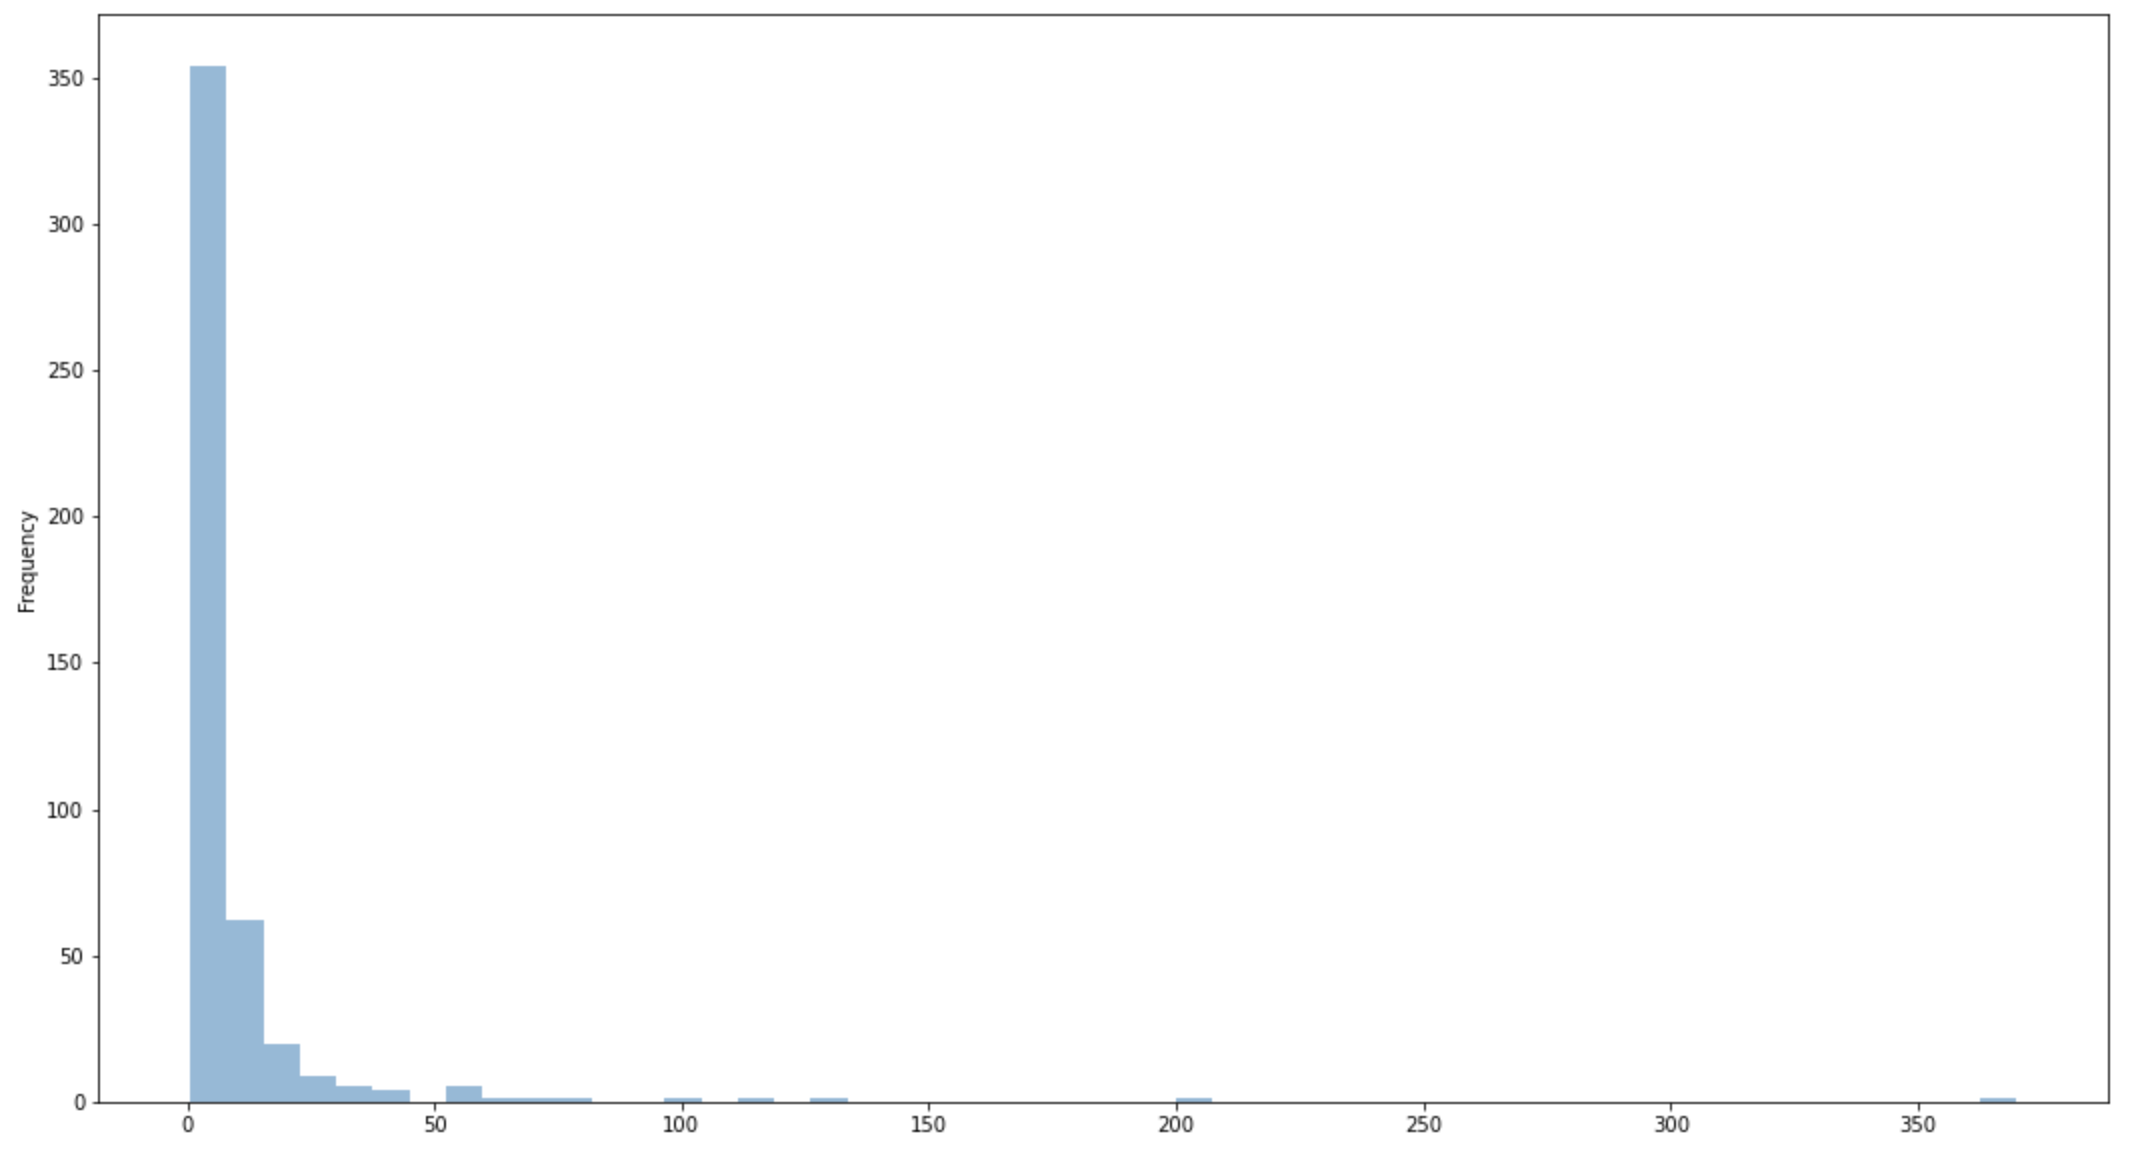
Plotting a distribution of Tobin's Q yields the following results:
As one would expect, most of the results centre between zero and one. Having said that, the distribution has a very long tail with a number of firms having their values in the hundreds.
Note that the chart does not display all obtained values. I purposely excluded negative Tobin Q values. Per se, negative Tobin Q is not incorrect. It simply means that the firm has either negative capitalisation or negative book value of equity. These may firms in financial difficulties, but I don't focus on those here.
Highest/Lowest values
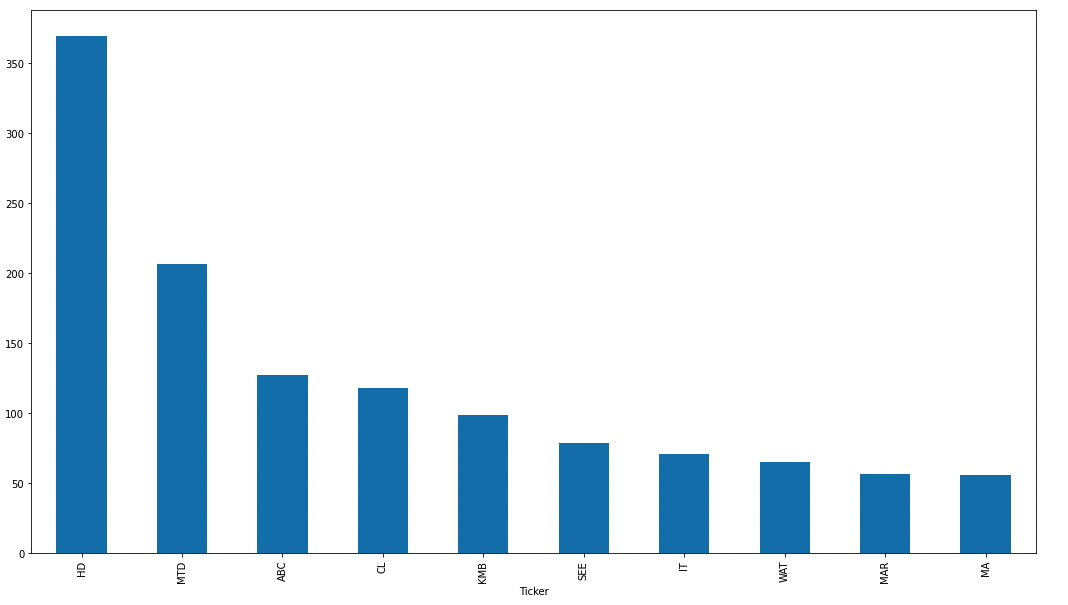
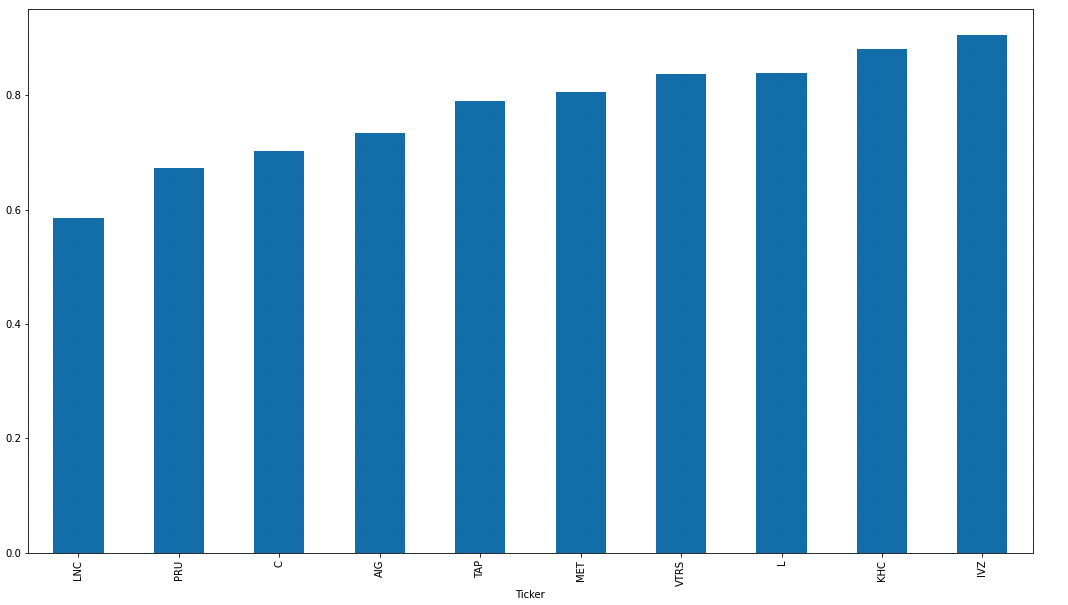
In the charts below I plot tickers with the highest and lowest values. Following the theoretical framework firms with Tobin Q above one may be overvalued. Firms with value below one maybe undervalued.
10 highest Tobin Q values:

10 smallest Tobin Q values:

Market value
Since one can calculate Tobin Q on individual ticker, one can do so also on the entire market.

Summing up market cap across all tickers and dividing the value by the sum of book values one obtains the value 4.73.
Other estimates
When searching the internet for other estimates of Tobin Q, I couldn't really find other comparable (and freely accessible estimates).
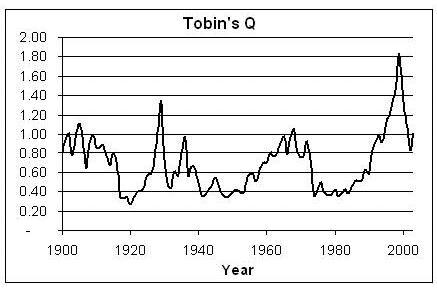
Helpfully, Wikipedia page on Tobin Q also includes historical estimates on the entire U.S. market until 2000. In 2000 the value was around 1 which is significantly lower then my estimate.
Clearly, market valuation has increased steeply since the 2000's (particularly in the last 5-10 years). Secondly, the Wikipedia published estimate is made on the entire U.S. market while I focus S&P 500 includes the most valuable companies only.
- Tobin's Q estimated by Andrew Smithers and Stephen Wright in early 2000's:

Limitations
The market value shown above may indicate that the entire market is overvalued. And it actually may be true. Market valuations have been steeply increasing in recent years on the back central bank/government support. Having said that, it is also important to take the results with a pitch of salt.
Firstly, my estimates should be seen as back of an envelope calculation and not rigorous economic research.
Secondly, particularly in the context of financial economics, concepts like Tobin's Q need to be interpreted carefully as they are often mere heuristics as oppose to firmly established and proven economic laws.